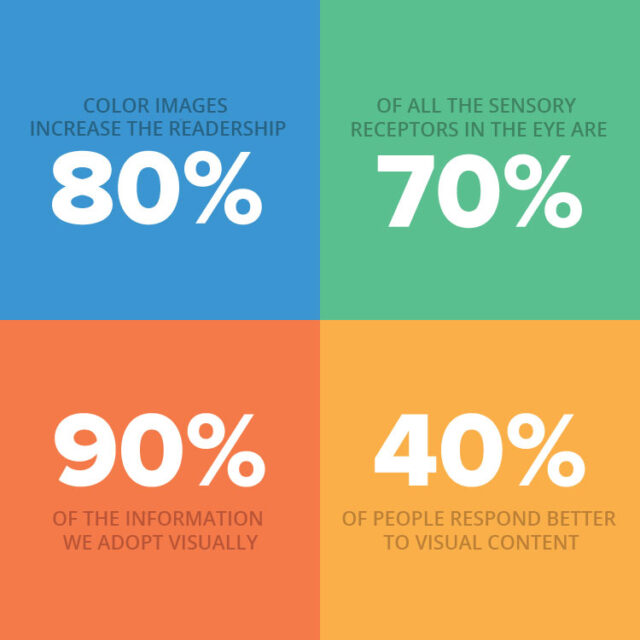
The claim that a picture says more than 1000 words not only confirms its veracity in today’s digital era, but also gaining importance day by day. With more information with which we are daily confronted and the general state of the data overload, it is easy to recognize the importance of the visual presentation of the same data. Visually presented content especially in infographics form, people absorb, understand, remember and share.
Interesting data into more interesting form
Quality content, even when itself is interesting to readers, the easier will reach out to them when it’s packed in a fun and creative way. Besides attracting attention, readers are inclined to share such content to their social network profiles.
You should often share knowledge through your newsletter or blog. About 65% of people learn visually, remembering what he sees and linking content with pictures, so enrich your educational character texts with visual aspect and results will be even better. Creating a story using data visualizations, offers the possibility of addressing their target groups of audience, whether it comes to technology geeks or tourists in search of a dream destination.
How to make good infographic?
We already wrote about this particular topic many time. So, the following articles are everything you need to learn about infographic design:
- What is an Infographic;
- 10 Tips for Making a Good Infographic;
- Create Your Own Infographic;
- Infographic Books;
- How to do Research For an Infographic;
- Free and Fun Tools for Creating Infographics;
- How to Get the Most from Infographics;
- Infographics – A Creative Way to New Clients;
- How to Make Animated GIF Infographics;
- Creating Infographics in Powerpoint;
- Designing Tools For Graphic Designers;
- Design Principles.
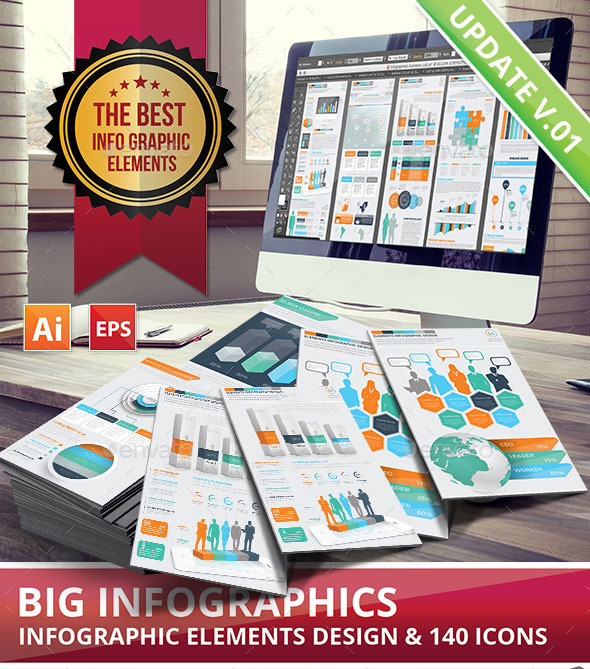
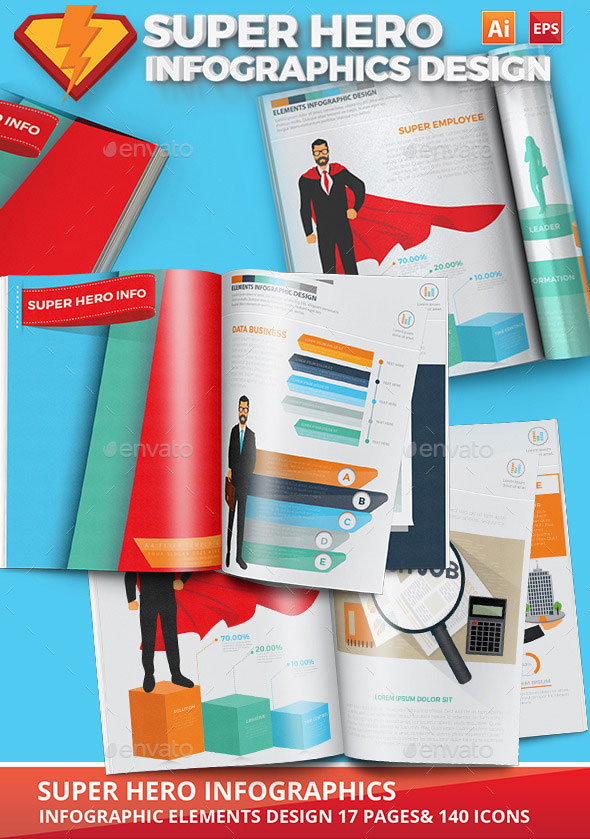
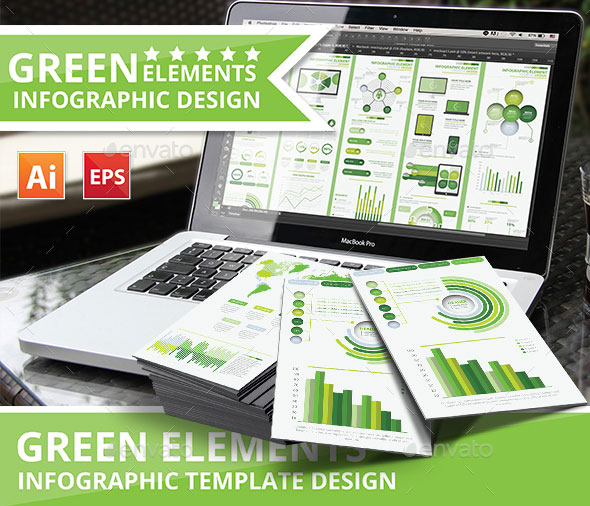
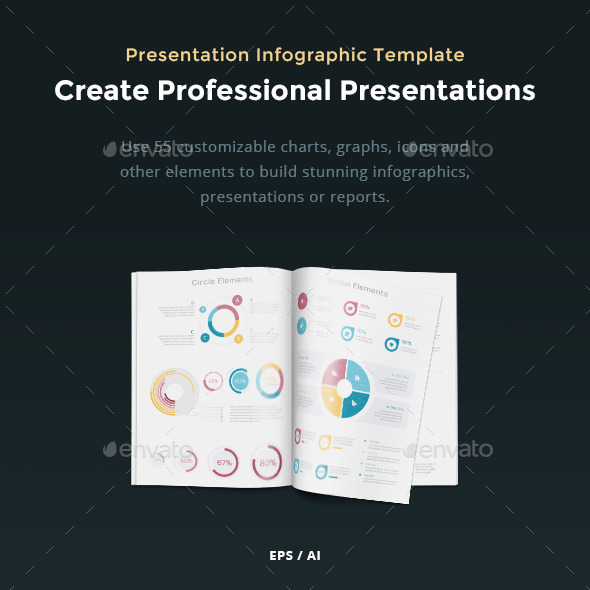
We hope that articles above will help you in creating your own infographic. Below, you can check out some great infographic templates and elements which you can use:
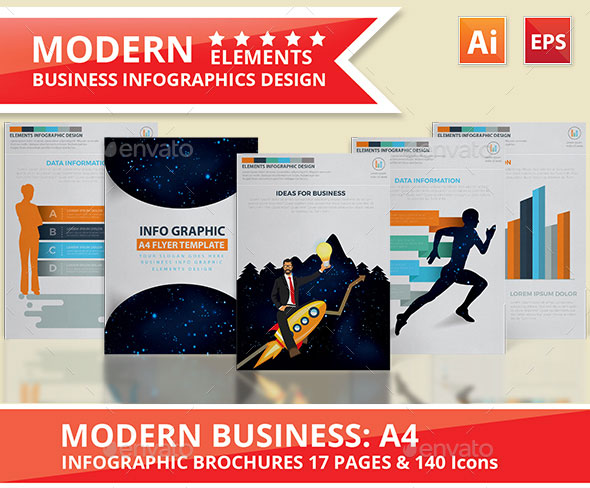
Modern Business Infographic Design
Bundle 10 in 1 Infographic
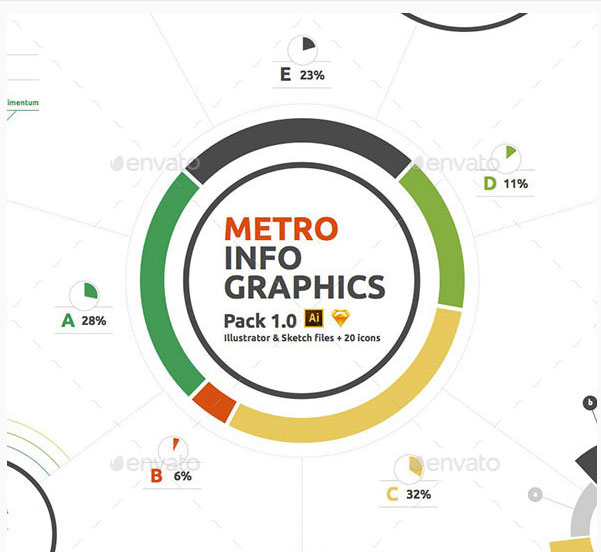
Metro Infographics Pack

