
Cole Nussbaumer Knaflic, the writer has spent over a decade analyzing data and using it to tell stories, through analytical roles in banking, private equity, and at Google also. She creates workshops and presentations for various organizations in order to improve data presentation and pens the popular blog www.storytellingwithdata.com.
The book Storytelling with Data: A Data Visualization Guide for Business Professionals teaches you the fundamentals of data visualization and how to communicate story with data on a effective way. With this book you will perceive the power of storytelling and the way to make data a key point in your story. The lessons in book are grounded in theory, but made accessible through numerous real-world examples form practice which are ready for immediate application to your next data presentation.
When it comes to data visualization, storytelling is not an inherent skill, and the tools that are available to us don’t make it any easier. Storytelling with Data shows how can you go beyond conventional tools to reach the root of your data, and it will teach you to use your data to create an informative, engaging, compelling story.
You’ll learn how to:
- Understand the importance of context and audience
- Recognize and eliminate the clutter clouding your information
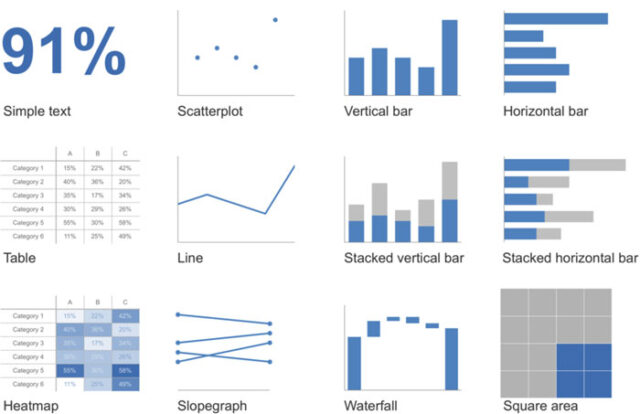
- Determine the appropriate type of graph for your situation
- Think like a designer and utilize concepts of design in data visualization
- Direct your audience’s attention to the most important parts of your data
- Leverage the power of storytelling to help your message resonate with your audience
The lessons in this book will surely help you turn data into interesting visual stories that stick with your audience. Get rid of your world of ineffective, boring graphs. There is a story in every data—Storytelling with Data will give you the skills and power to tell it properly! If you have not yet read it, you can find the book here.


