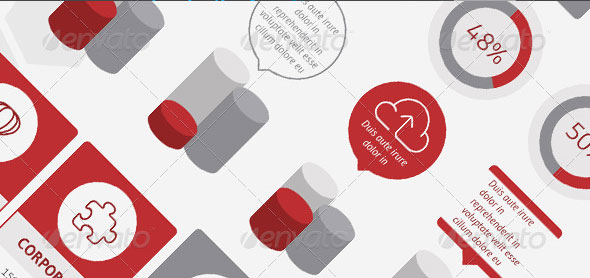
Infographics (information graphics) are our favorite topic. Just because they are so visually beautiful, clear and modern. A well-designed infographic is always nice to see.. Infographics allow faster reading, saves space and looks good.
For what can be used information graphics?
- simplifies complex data or processes
- ” heavy ” information is converted into innovative content that attracts attention
- is useful for sharing on social networks, thus replacing the bare text messages
- has a greater significance for the algorithms that determine what we will find in the search engines and social networks
Many companies underestimate the power of infographics, giving them less importance of blogs and tweets to raise their brands. Information graphics can significantly help with a couple of useful ways regarding its use in promoting your ideas, business or brand. So, start using them! All your stories, different types of data that surround you and your business, simply turn into the infographic. Use the informaion graphics as a slider which includes various elements of infographics. Convert your infographic in attractive and interesting videos. Given the fact that Youtube channel is the second most used search engine (after Google), video contents justify its importance and effectiveness. Use infographic to attract users / audience towards your related facilities of high importance, such as surveys with the ability to download or some other articles and publications.
Use infographic to show the contents of your blogs and articles, media releases or other content that you post, to promote the aforementioned text content.
Infographics provides the ability to create long-term value of the brand as well as numerous opportunities to win and retain your customers / users / readers / audience. And of course, do not limit yourself to one distribution channel … Use all available channels. Start today through social networks, and watch the results. Adopt the ways to make you people noticed, and most importantly, remember.
Below are great examples of Information Graphics Mega Packs for Download:
Megapack Infographic Set
In this pack you will get 150 different unique infographic elements for building your own infographic. Download here.
Vector Graphics Mega Collection
Need graphics to boost your creative projects? Well here yo go! This is a stunning collection of the highly popular infographic vector element sets. All sets contains lots of different elements and now as a bundle you’ll get huge amount of creative vector elements for a cheap price. Download here.
Infographic Elements
A huge set of information graphics elements including charts, tables, icons, bar graphs, data visualization, elements, ribbons & much more. This bundle is propably the biggest. All elements are vector based, grouped and organized for easier use.You can edit everything including shapes, colors and text. The elements would be perfect for both print and digital use. As vectors, you can go to unlimited sizes & resolutions without loosing quality. Download here.
SEO Infographic Bundle
SEO infographic elements part 1 included:
- 60 icons: seo team, gzip, web development, traffic analysis, right decision, link bait, page error, open access, wrong decision, seo project manager, photo presentation, brain storm, page rank, .htaccess, file sharing, budget planning, keywords, code, place optimization, monitoring, closed access, domain registration, viral marketing, design, idea, links building, social media, traffic, mobile marketing, search engine, responsive design, seo training, robots.txt, cloud computing, seo consulting, ping, html5 impact, page quality, clean url, ban, press release, seo decisions, google panda, seo spy, sitemap, copywriting, page speed, infographic, anchor, blog, forum, portfolio, media, marketing, seo, contact, laptop, pc, smartphone, tablet
- 4 tooltips
- 10 graphs
- 10 schemes
- 1 timeline
- 2 maps
- 2 Fully editable and layered files: .ai cs and .eps
SEO infographic elements part 2 included:
- 50 SEO icons: revenues, web crawler, anchor, gzip, infographics, web development, SEO page speed, social media, SEO speed, traffic analysis, copywriting, settings, data transfer, link bait, page error, sitemap, pay per click, knowledge, budget, google panda, SEO spy, network protection, geolocation, ping, advertising, html impact, press release, SEO decisions, page ranking, .htaccess, file sharing, budget planning, web hosting, SEO performance, SEO consulting, robots.txt, SEO structure, keywords, code, place optimization, monitoring, SEO strategy, search engine, SEO project, viral marketing, design, idea, links building, social media marketing, SEO training
- 5 different types of tooltips with different directions (north, east, west, south, north east, north west, south east, south west)
- 5 different types of charts: pie, area, line, bar, column
- 5 schemes
- 3 fully editable and layered infographic files: .ai cs, .ai cc and .eps


