
The global financial sector has a rich history and has come across many difficulties, but today more than ever before, if you want to enlarge your profits, investing and being an active trader is the best way to do so. Of course, it’s not like just anyone can swoop in and start, as proper education, knowledge, and, perhaps the most important feature, experience, are a must.
The best way to better describe how difficult it really is is by looking and all the qualities one trader has. Namely, since the market is so big, knowing your niche is the first step. Furthermore, being objective is perhaps the biggest problem to us all, but that’s precisely the main thing that makes a real difference, as it is crucial to avoid making decisions based on emotions.
Now, by reading all this, one may come to a conclusion that this is the most demanding job in the world, but just like a lot of practice and mental toughness are a must, there are also tools that can make your job easier, and here, that’s about predictions based on routines.
There are plenty of charts available, and if you want to be successful, you should know at least several of them, with candlestick being probably the most important, so, in order to simplify it, let’s focus more on that now.
What are they?
Looking at stock price graphs is a daunting task at first. The historical data recorded and visualized on platforms such as thelazytrader.com show price action on a stock, giving the well-trained eye an opportunity to use them to improve their predictions. They are amongst the most powerful and insightful trading signals, which is why we’ve compiled this list of 11 of the most important patterns every trader should know how to recognize and use.
1. Hammer
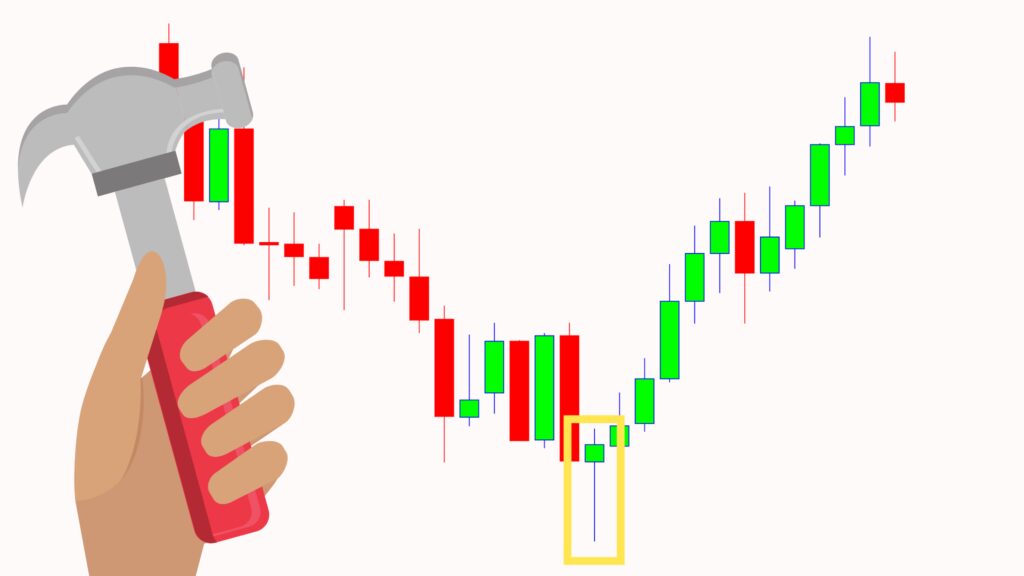
Let’s start by mentioning that here, we have a body and shade, and while the first one is short, the second one is longer, and it follows the downward trend. There are various colors, and it is crucial to know that brighter colors represent a stronger bull market than dark ones. To explain it in a simple way – it means the price on the market is pushed down by sellers, with buyers trying to force it up again.
2. Morning star
The main fact about this one is that it suggests a start of an upward climb and that it is commonly used. It consists of three bars, with the second one being the most significant because the sole focus is on uncertainty as to which out of two sides will come out on top.
3. Inverse hammer
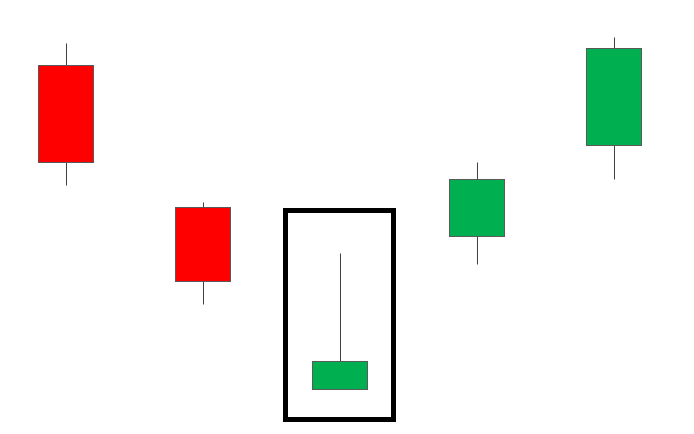
This one is almost the same as the regular one, but with a few differences. The main one is that the top shadow is long and the lower one is short, which is totally opposite when we compare it to the regular one. It means that sellers cannot push the price down because of the huge pressure of the buyers, and it shows that they will soon take control.
4. Piercing line
This pattern is made of two bars, both of them are long, and the brighter bars follow the darker ones. We need to mention a big gap between them, or to be more precise, what you should look for to notice this gap is when the price at the end of the first one differs a lot from the price at the beginning of the second day. It shows the pressure of the buyers, and when we speak about the value, it is the same or higher than the mid-price of the day before.
5. Three white soldiers
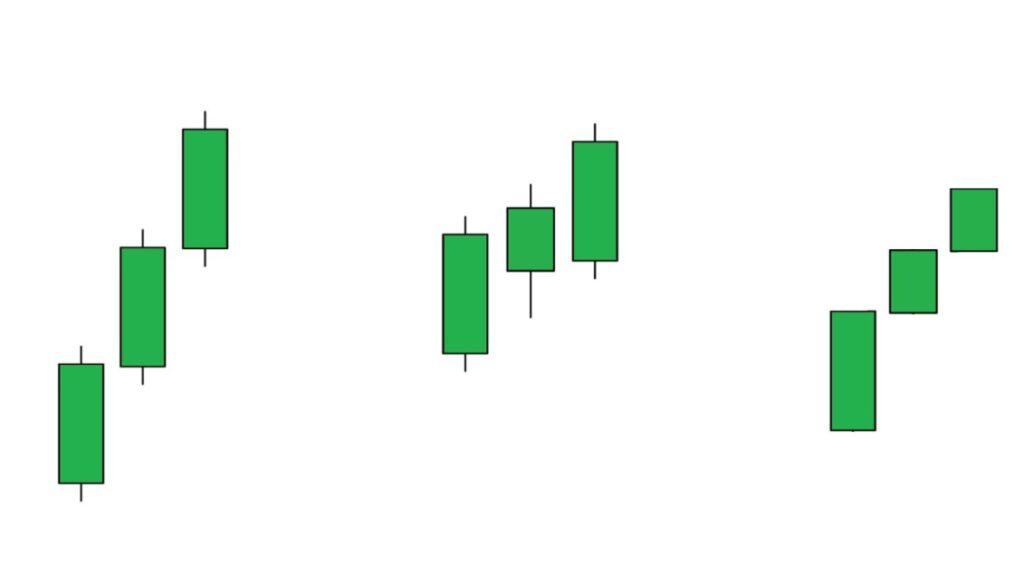
This one lasts for three days-hence the name. It is made of three bright bars, and each of them is long and with small shadows. The main about his one is that it shows a constant upward trend where every next day, the price is much higher than the day before, meaning that it indicates a constant rise that happens after a downtrend.
6. Hanging man
When we compare this one to the first pattern mentioned, we will notice both have the same form, but there is one crucial difference between them. The first one is related to the rise, while the second one is related to the fall of the value. It is a great indicator that some big sell-off occurred, but the buyers are pushing the price up again. A notable thing here is that it is most often a sign that the bulls will lose their control.
7. Evening Star
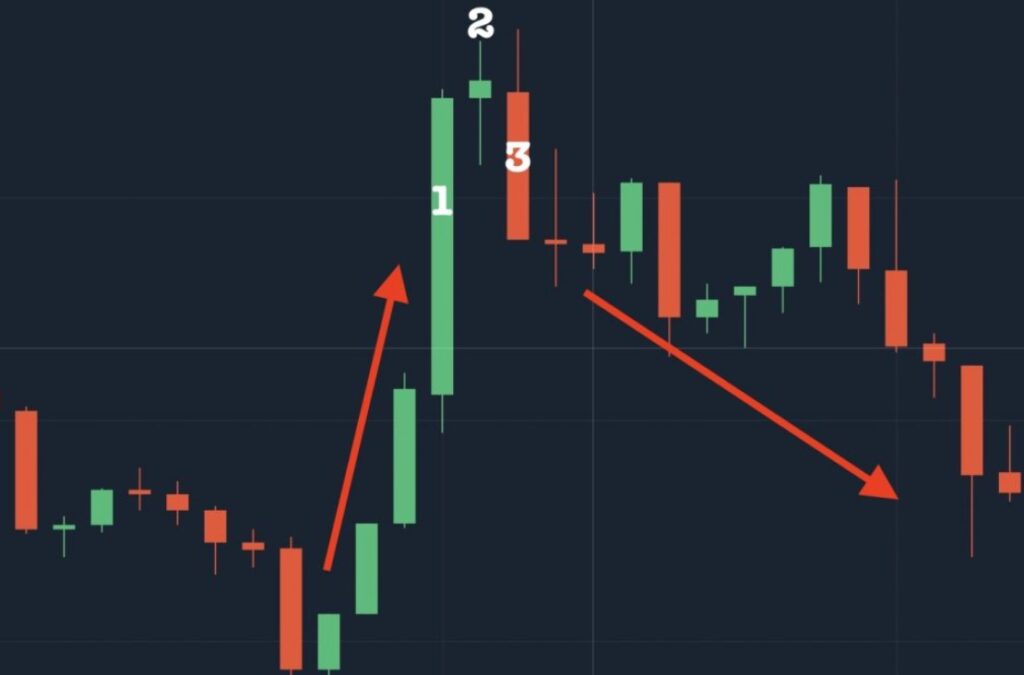
This one has the same structure, but it’s opposite to the morning one as it indicates a potential change of the uptrend. The focus is also on the second bar, as it indicates slowing down of upward momentum before a bearish move lays the basis for a new fall.
8. Shooting star
This one reveals that the price on the market is a little higher on opening and slowly changes until the ending just to become almost the same as the opening one. It may confuse those not that into this world as it is quite similar to the inverted hammer, but with one huge difference, as here, it’s about the uptrend.
9. Three black crows
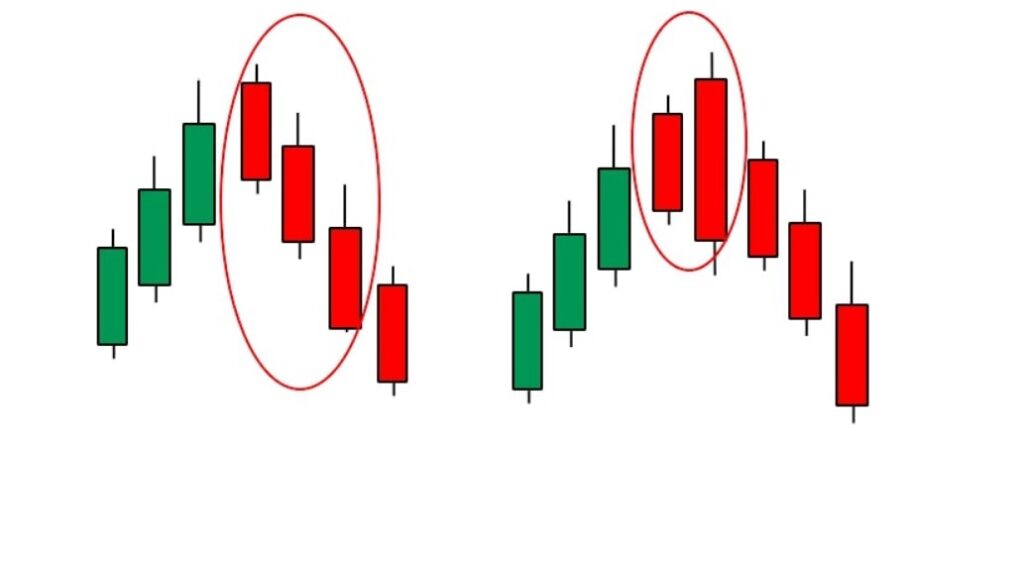
It is a term that’s often used in this world, and as for the pattern, it consists of, yes, you have guessed it right, three (darker color) candles. To better explain it, it represents a start of a bearish downtrend which suggests that the sellers have overtaken the buyers during three consecutive days.
10. Doji
The word Doji literally means a mistake in Japanese, but here, it’s more used to describe rarety. Namely, when the opening and the closing price are the same or pretty close, despite overall volatility, that’s what Doji represents. It’s not something that often happens, but that doesn’t make it any less important.
11. Dark cloud cover
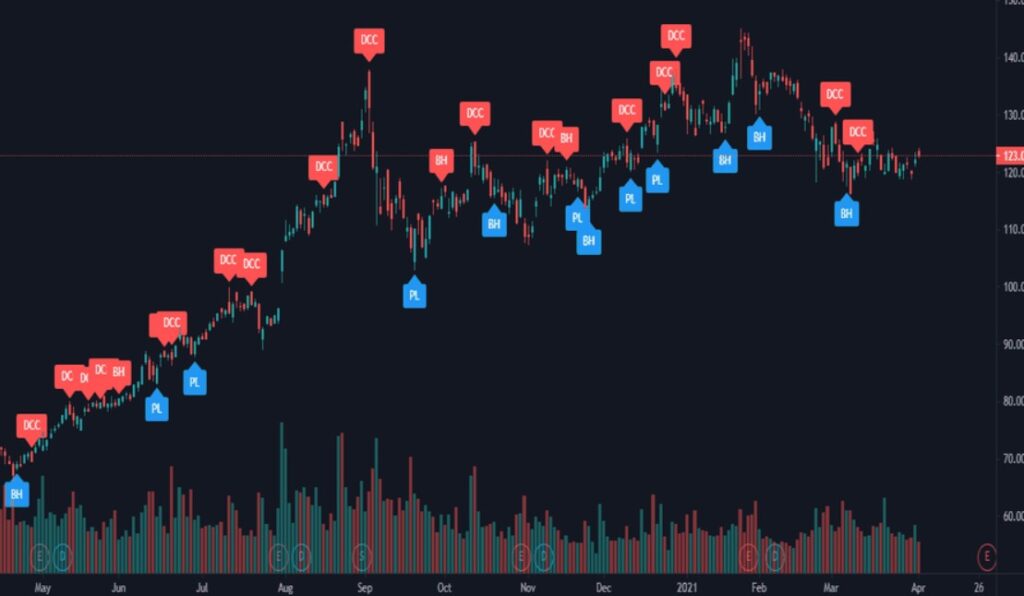
This one shows a weakness in the uptrend, but don’t confuse it with the evening star since it is made of two candles. The first one is a bullish candle followed by a clear gap that signifies a change, which is then turned into a bearish candle that closes below the midpoint of the prior bullish candle.


